
On the path to climate neutrality, we take responsibility.
To achieve the objective of decarbonisation by 2045, we are implementing numerous measures. At Contargo, we see particularly strong potential in combined transport. By shifting our transport operations from direct trucking to rail or inland waterways, we are already reducing emissions by an average of 43%.* In this way, we can actively contribute to the transport transition. However, the remaining emissions must also be calculated, analysed, avoided and reduced.
*Calculation in accordance with DIN EN 16258 and the GLEC Framework (well-to-wheel, market-based approach); average CO₂e emissions of all transport operations carried out by Contargo in 2025; individual routes may vary.
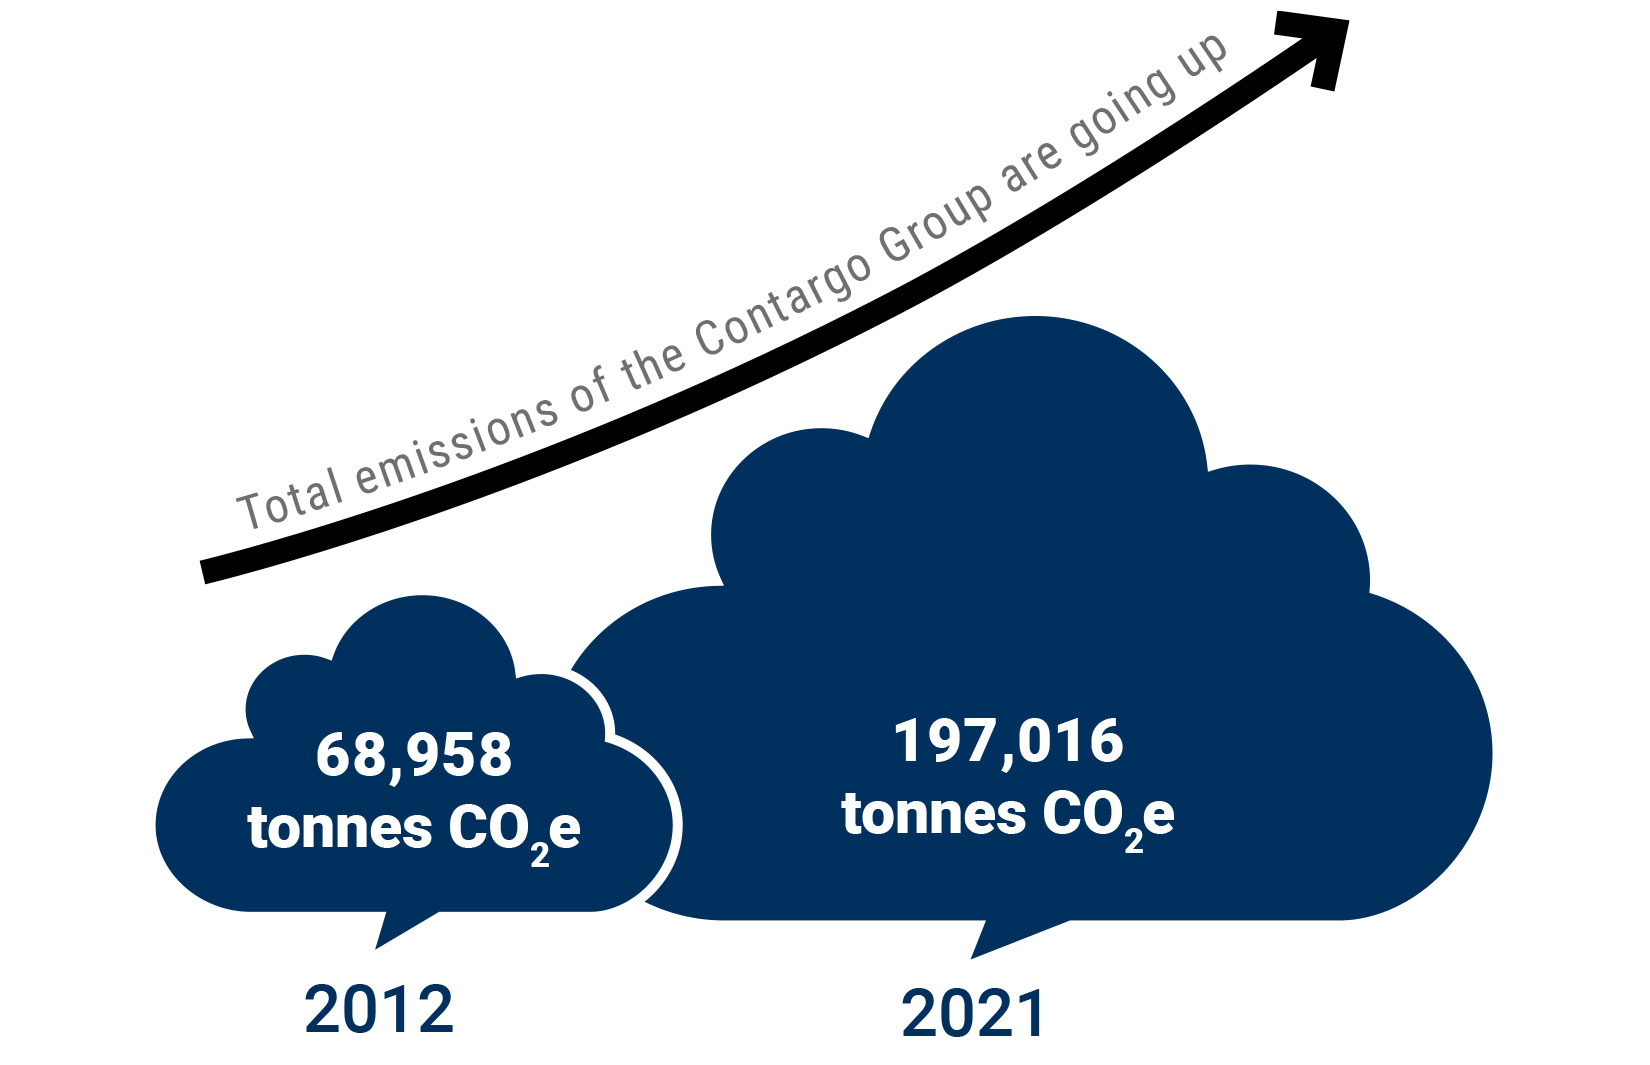
More containers mean more emissions
In terms of quantity, our emissions have increased sevenfold since 1990. This should not be surprising, since our network and the volumes transported by us have also grown tremendously. As we become Europe's largest hinterland logistics network, our overall emissions will also initially continue to increase due to the increase in handled volumes alone.
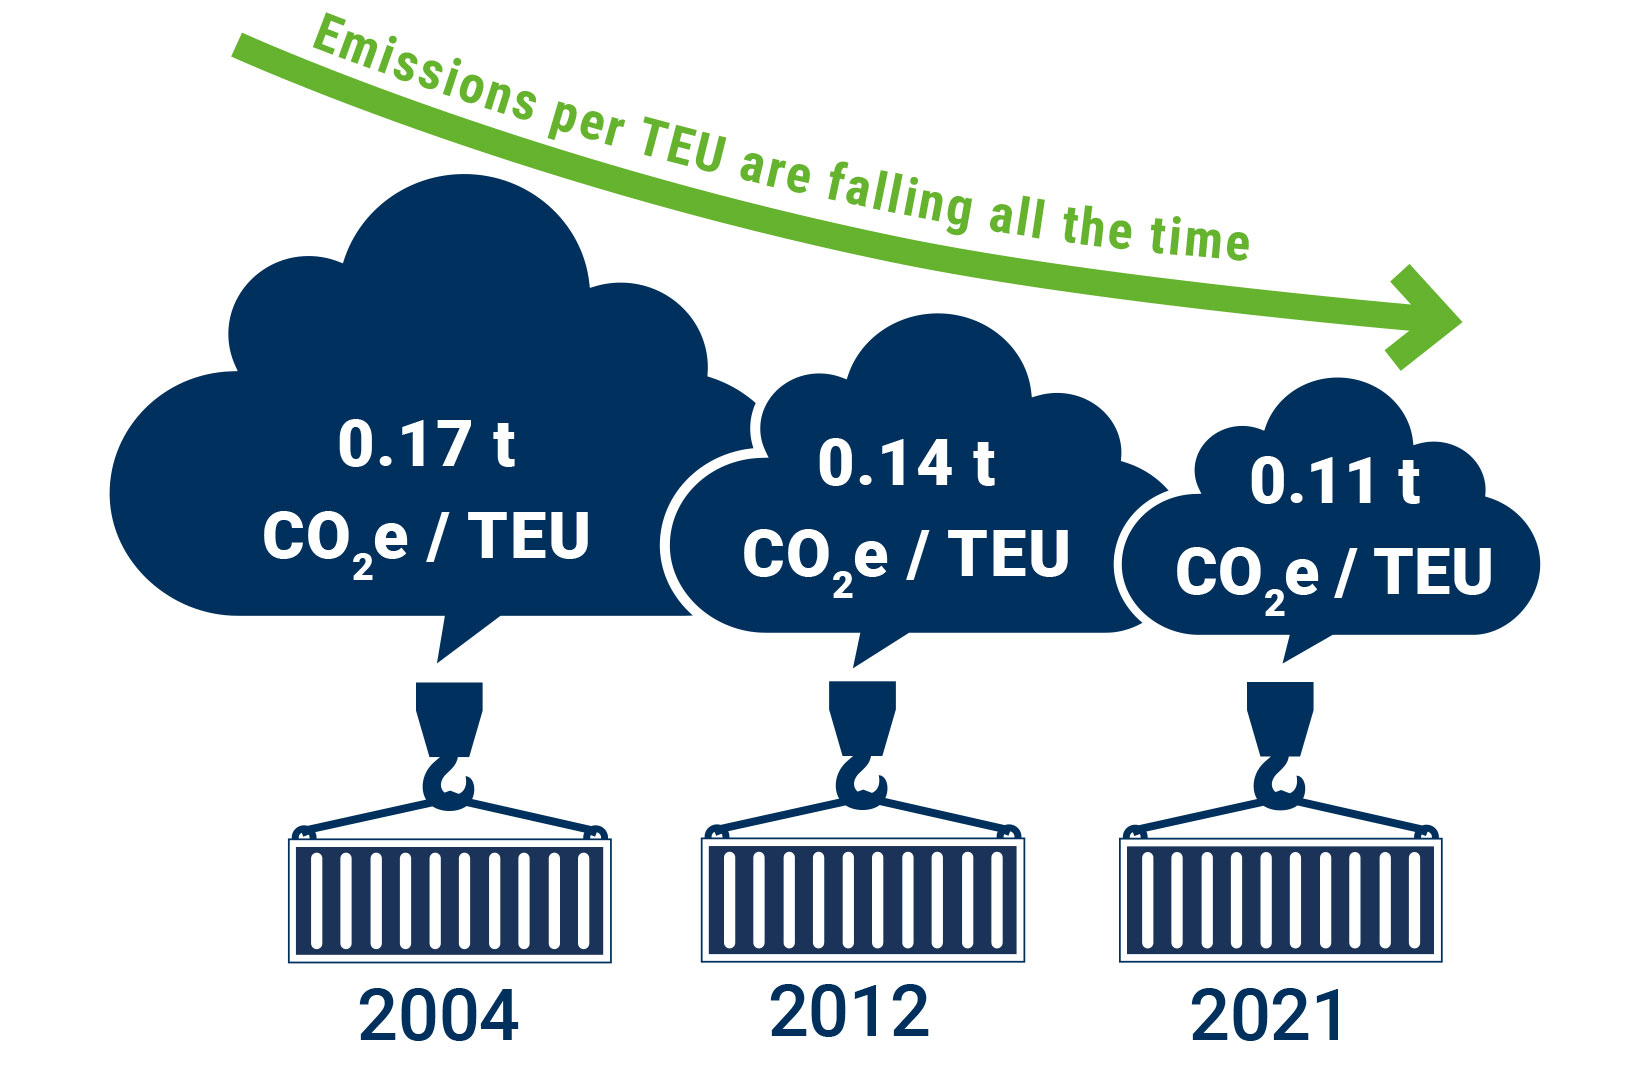
Fewer emissions per transported TEU
We have implemented a range of measures over the past few years to reduce our emissions per TEU. This allowed us to reach our emissions target for 2020, a 10% reduction in emissions in comparison with 2012.
Our certified calculation method
It's important to know how many emissions we actually cause. It's the only way to correctly assess our climate protection measures.
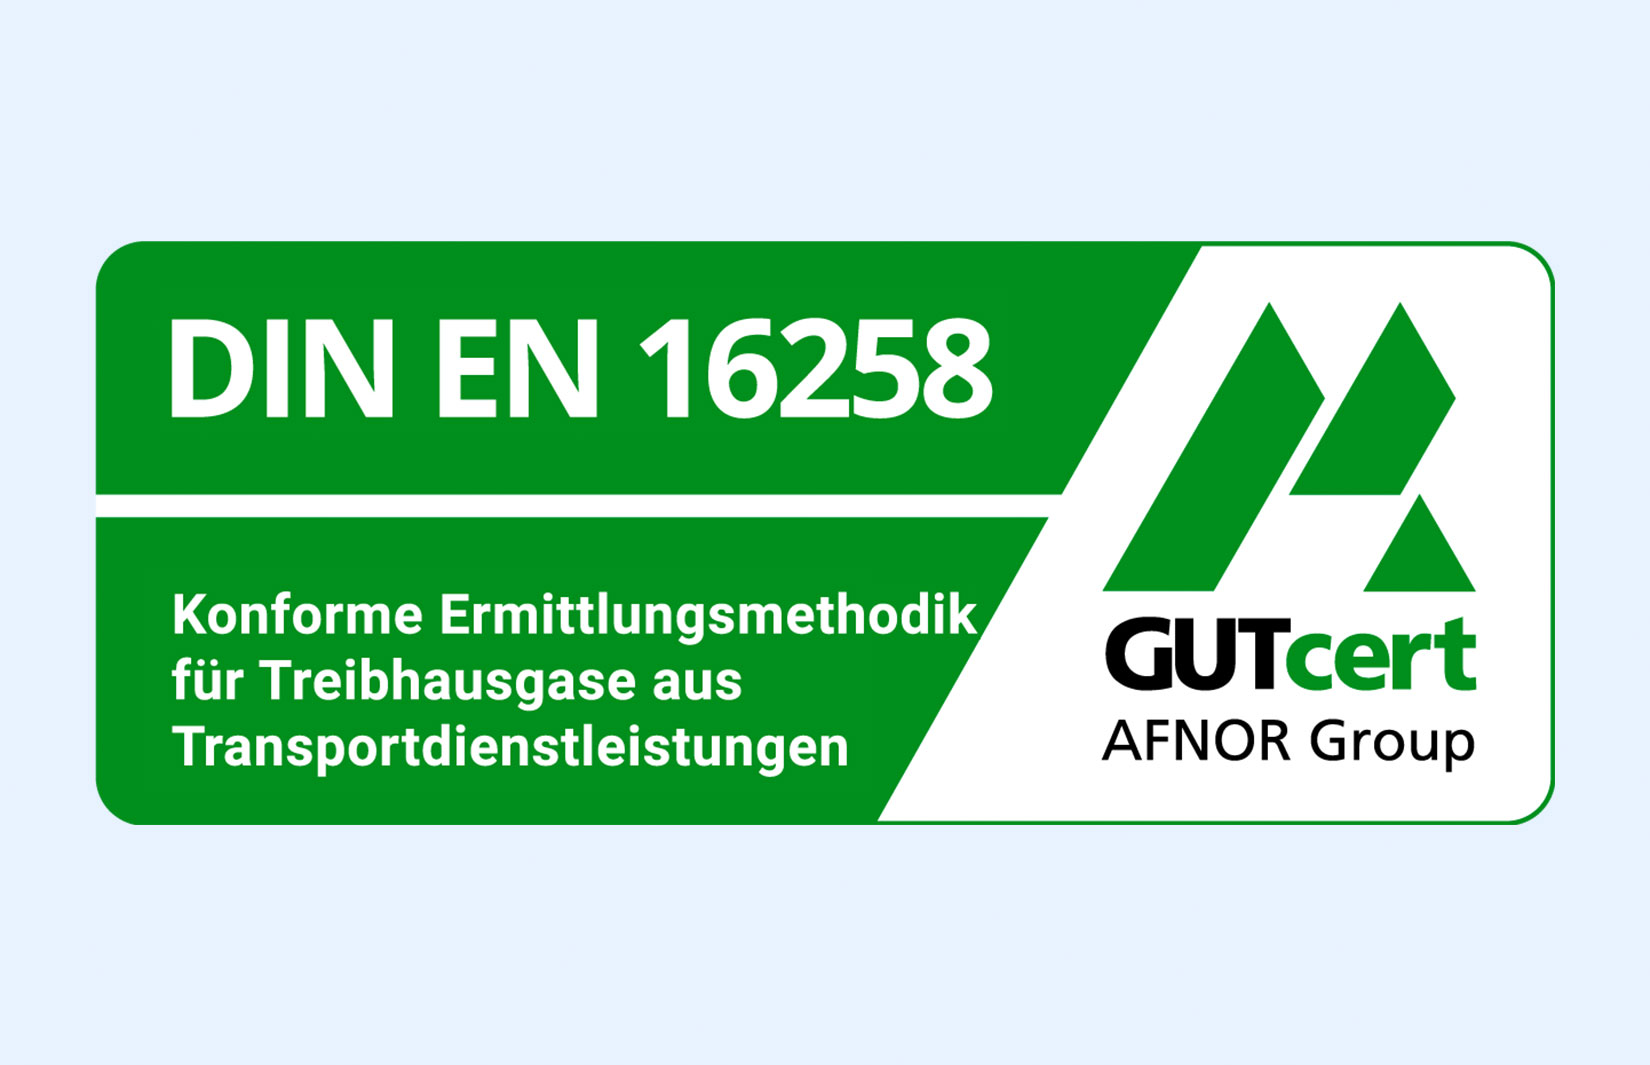
Our CO2e calculation method has been officially certified in accordance with DIN EN 16258 by the accredited certification authority GutCert. This means that we have demonstrated that, on the basis of our existing structures, we are able to fully, consistently, transparently and sufficiently accurately record and manage the relevant data.
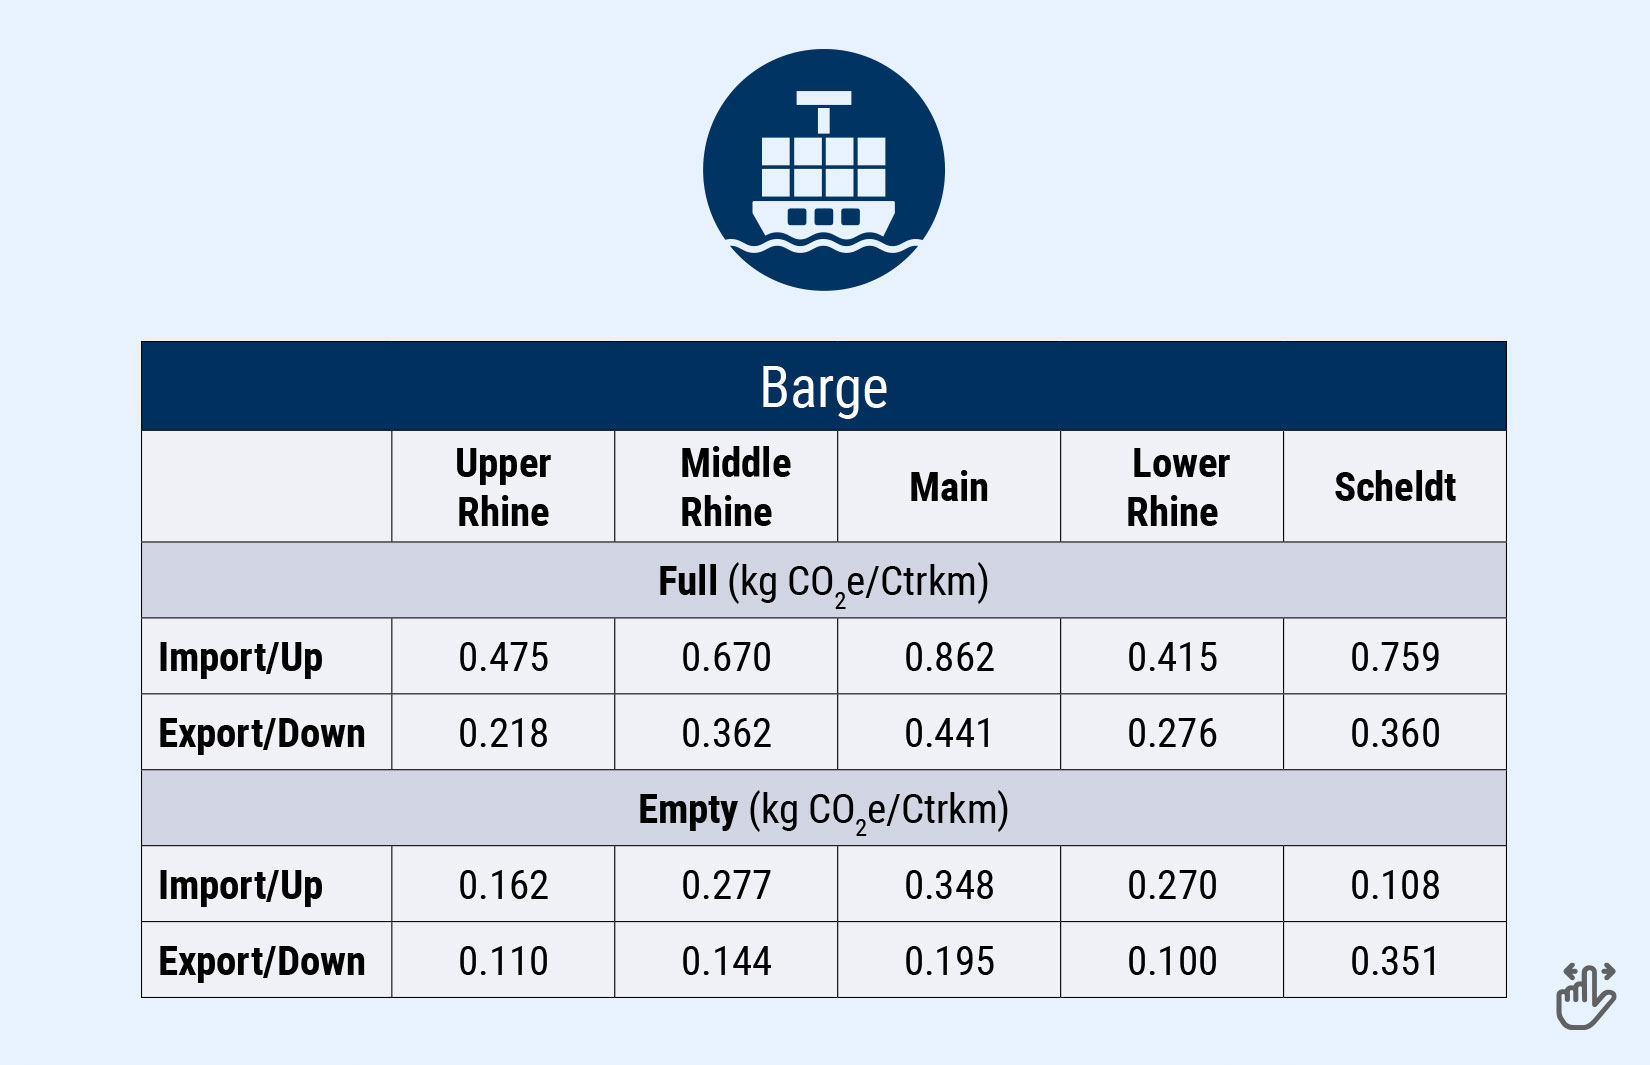
CONTARGO-specific emission factor x no. of containers x kilometres = emissions in kg CO2e
Example calculation: Transport of a full container (ctr) from Mannheim terminal to Rotterdam:
BARGE = 215 kg CO2e/Ctr
Via inland waterways: 0.362 kg CO2e/ctrkm x 1 ctr x 594 km = 215 kg CO2e
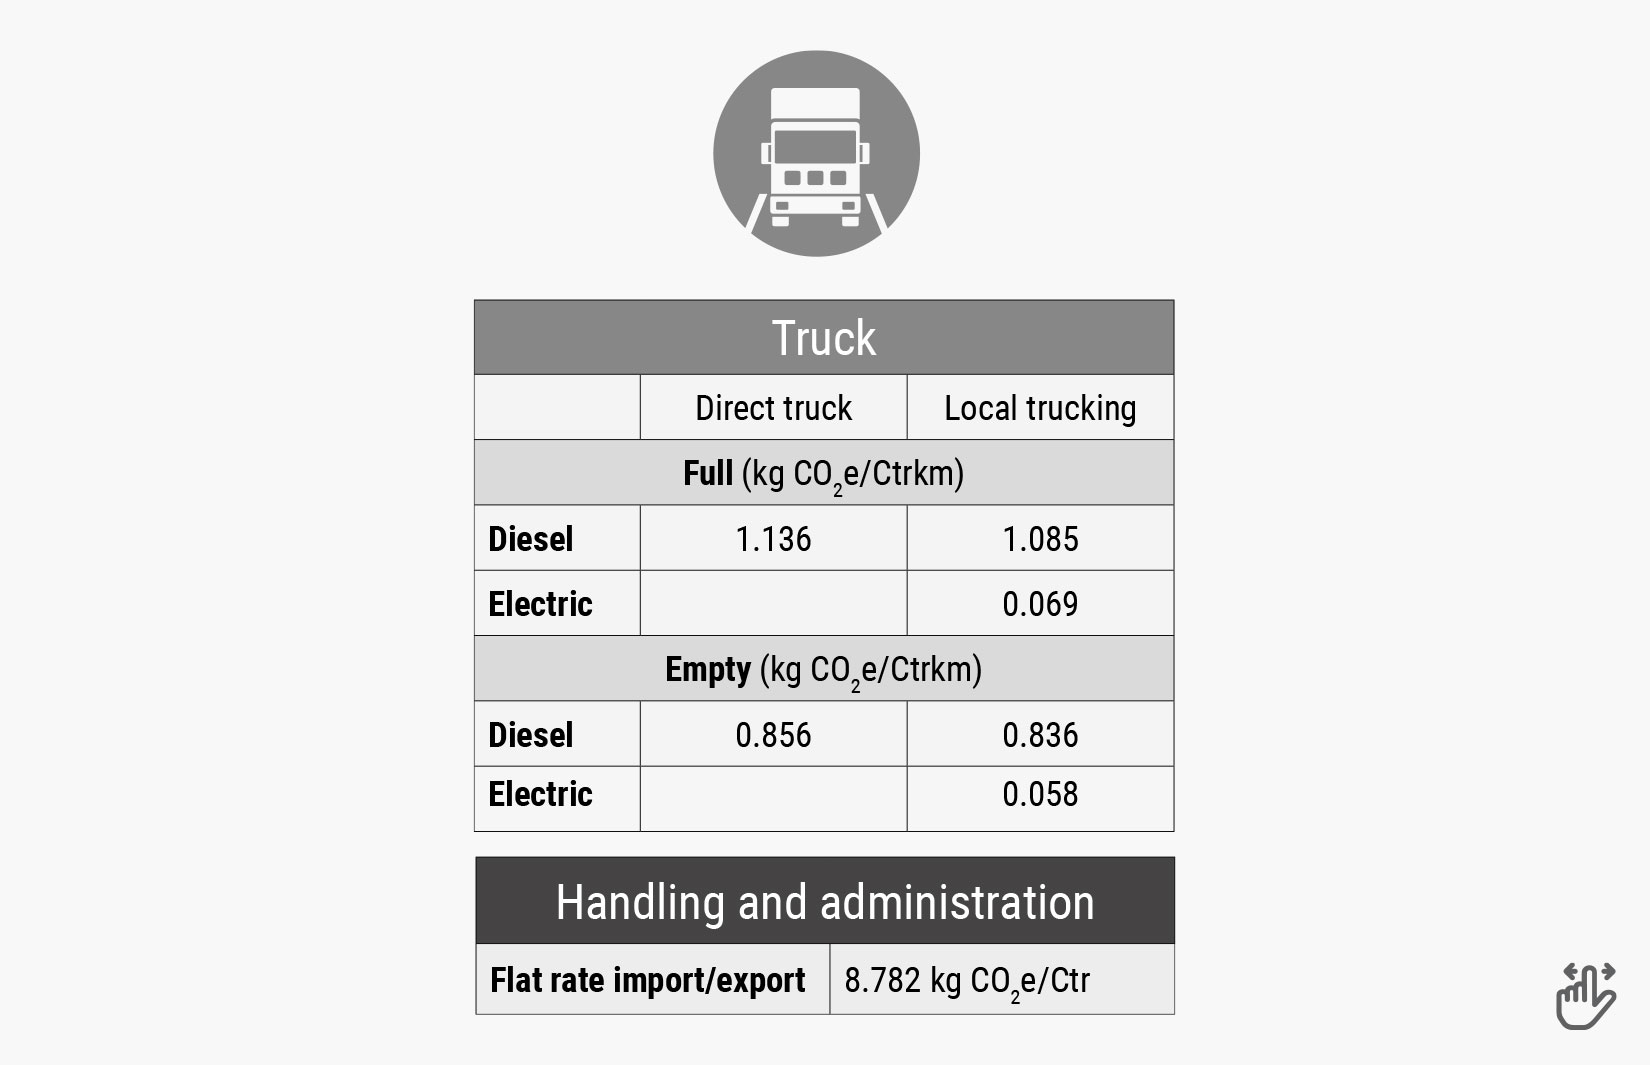
TRUCK = 596 kg CO2e/Ctr
Via direct truck: 1.136 kg CO2e/ctrkm x 1 ctr x 501 km = 569 kg CO2e
More transparency for the perfect CO2e-strategy
The composition of our emissions
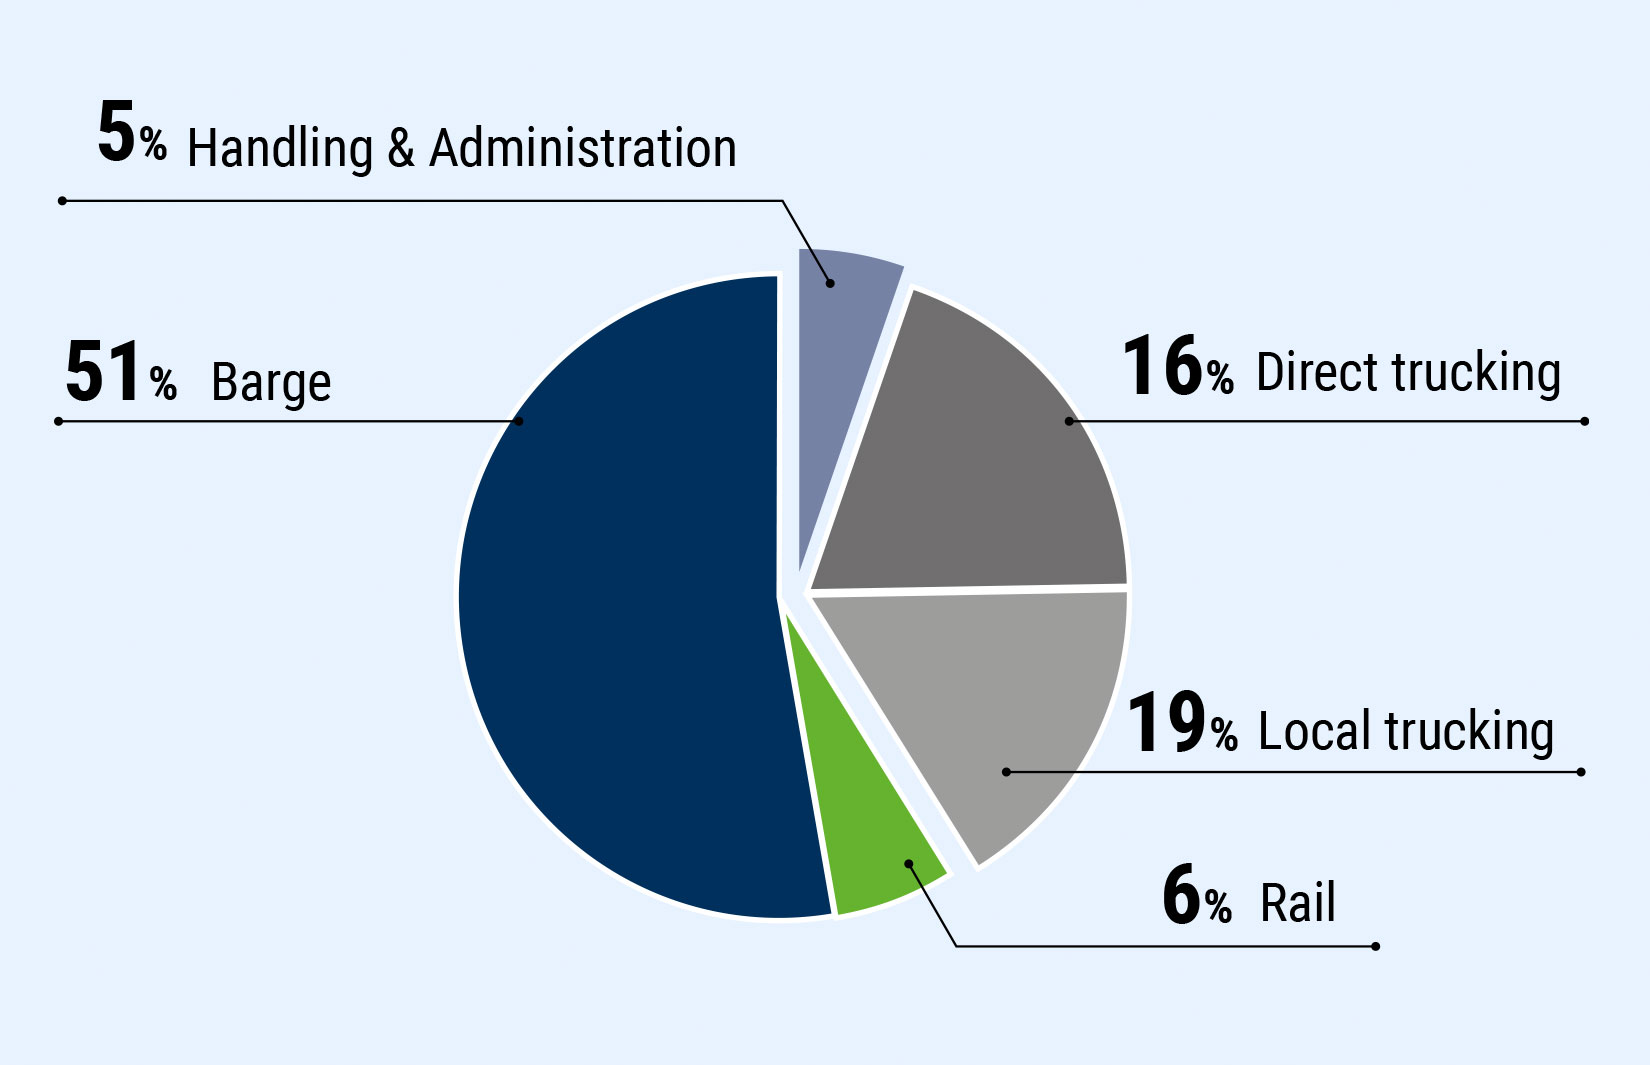
We've determined the overall quantity of emissions at CONTARGO, but how is this figure broken down̈? This analysis allows us to see where we need to take action most urgently.
Barges
Most of our transports, and our longest trips, are made by barge, so it's not surprising that this mode of transport is responsible for most of our emissions.
Rail
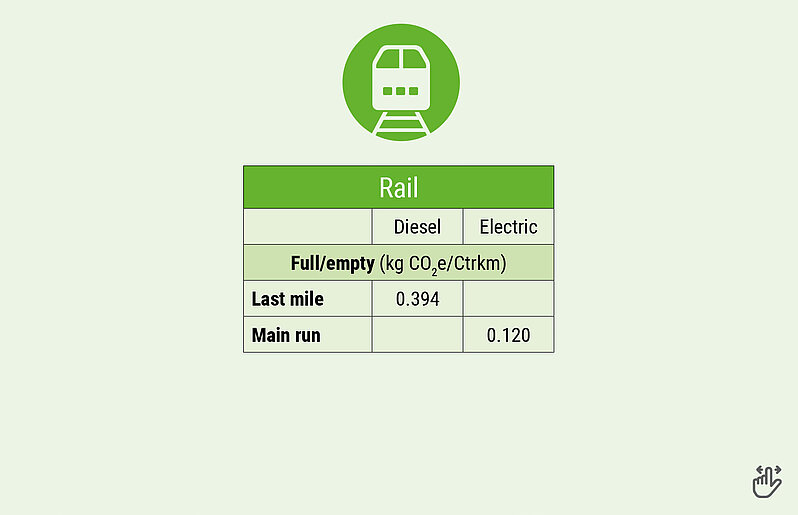
Our rail network is largely electrified and produces hardly any emissions at all compared with other transport modes.
Direct trucks
The story is a little different when it comes to trucks. Although trucks are responsible for just 8% of our model split*, they currently generate 16% of our CO2e emissions.
Terminal trucking
In the intermodal transport area, we use short-distance trucks: Around 750 trucks which are responsible for almost one fifth of our CO2e footprint.
Transshipment and administration
Activities at our terminals and sites account for just 5% of emissions.
Transshipment and administration
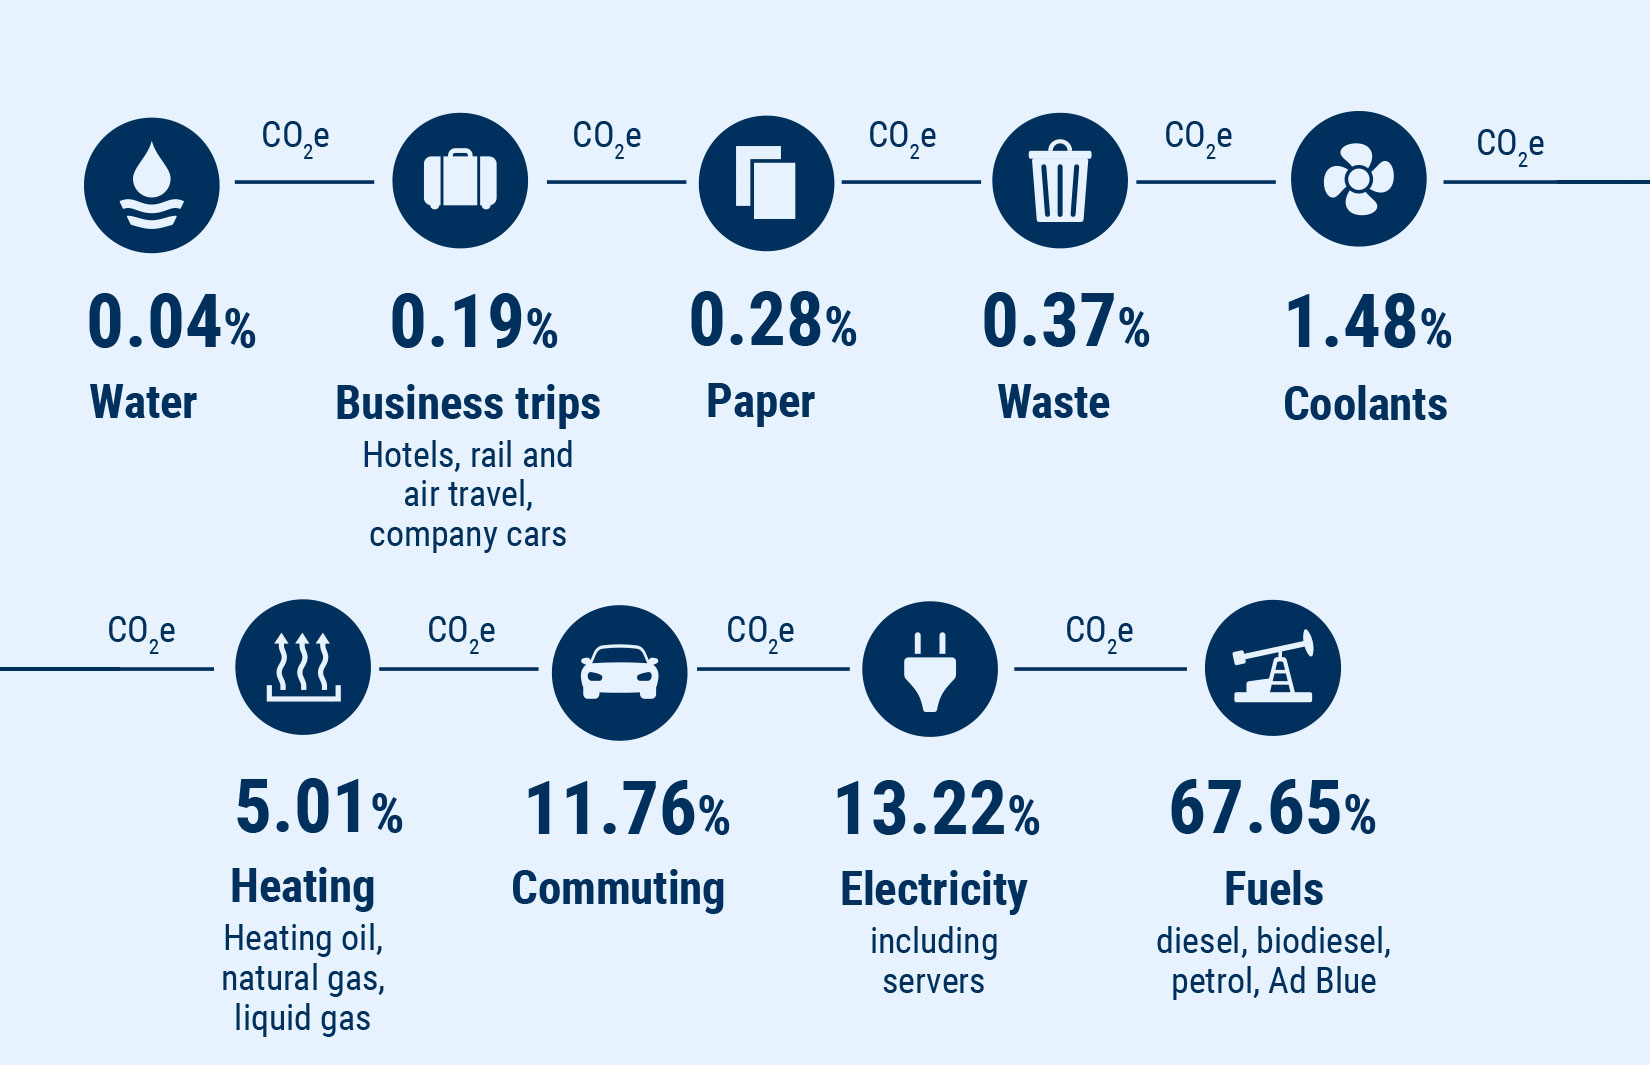
What pushes emissions up here?
When looking at our terminal activities as a whole, fuel consumption stands out in particular, accounting for 67% of CO₂e emissions. Terminal vehicles and reach stackers are primarily responsible for this. Our current major challenge is to electrify them because, when renewable electricity is used, market-based emissions are comparatively low depending on its quality. Our aim is to use advanced technologies that meet operational requirements and reduce energy consumption.
1, 2 or 3? The SCOPE classification of emissions
What SCOPE do all of our emissions actually fall into? Which are directly caused by us and which are indirectly caused by us?
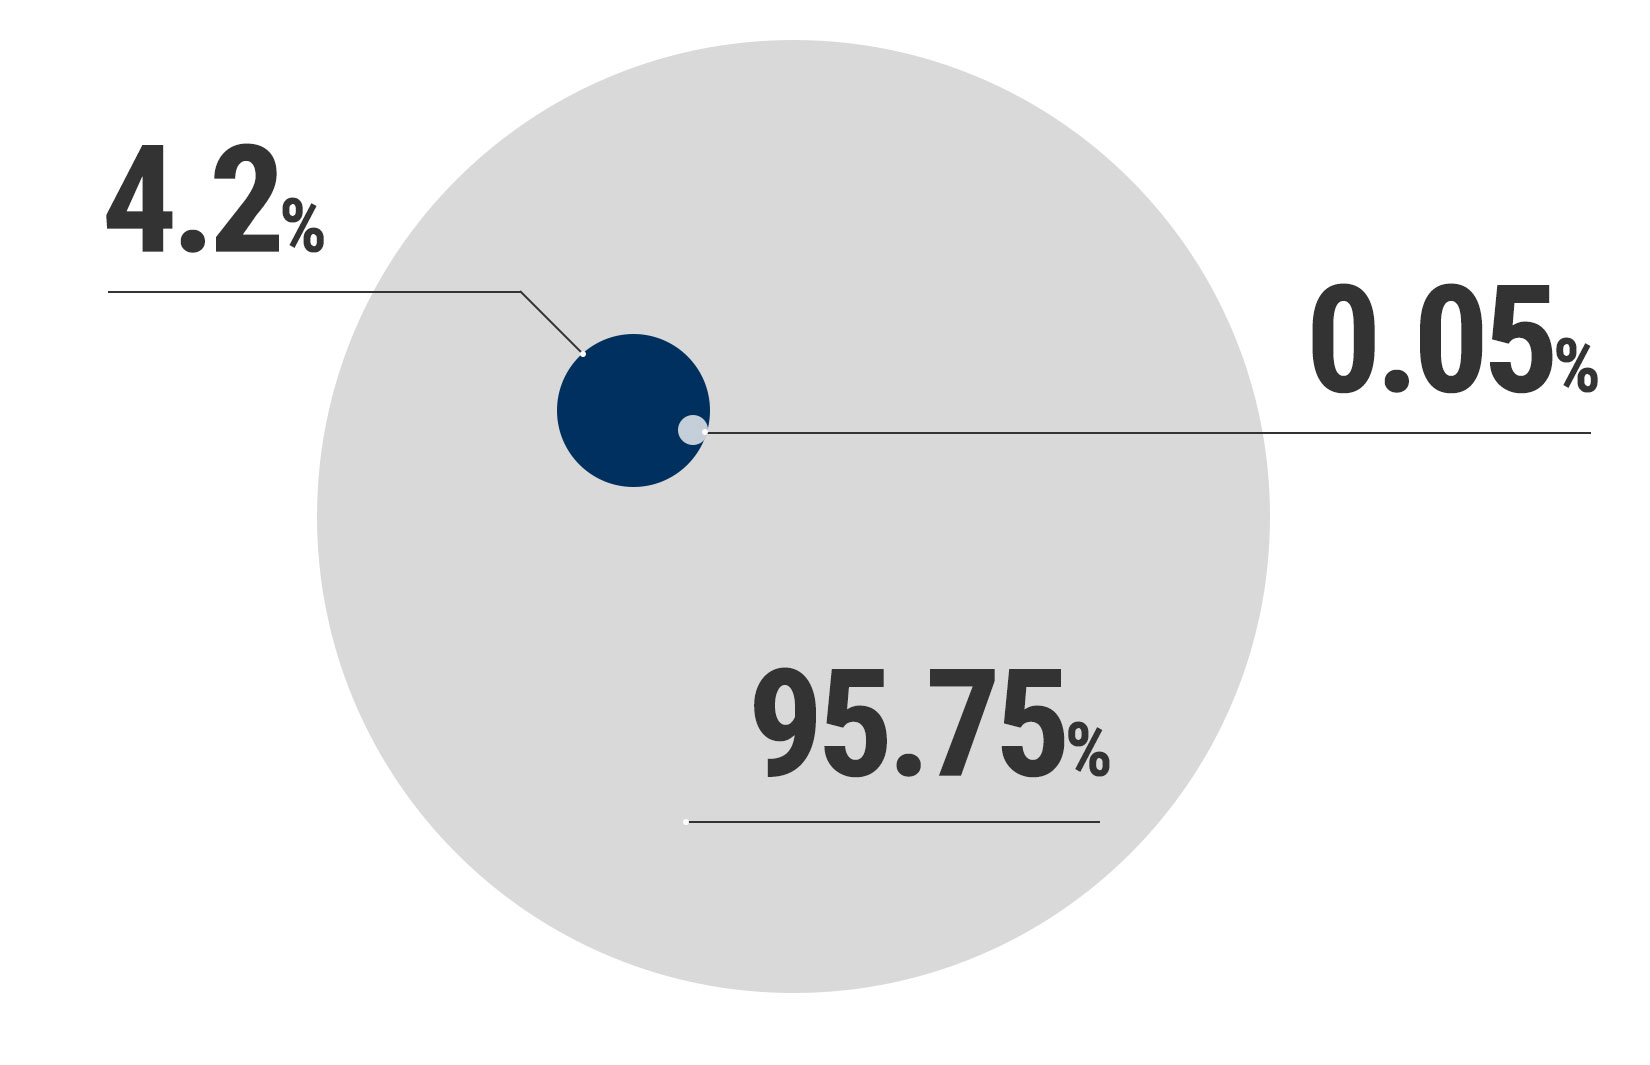
SCOPE 1 / 4,2%
SCOPE 1 – direct emissions
CONTARGO only causes around 5% of our emissions directly – our reach stackers burn diesel, our office buildings need heating and our company cars run on diesel, too.
SCOPE 2 / 0,05%
SCOPE 2 – indirect emissions
These are emissions from purchased energy such as electricity. Such emissions are classified as SCOPE 2.
SCOPE 3 / 95,75%
SCOPE 3 – indirect emissions
SCOPE 3 also relates to indirect emissions. This group comprises our subcontractors, so our truck, rail and ship contractors. Since these are generally long-term business partners, we also see ourselves as responsible here. We believe that a partner-like, respectful business relationship with our service providers is essential. Emissions from commuter traffic, business trips and waste disposal, for example, are also included in this category.
We believe that taking a holistic approach to emissions is vital. That’s why we always analyse emissions using the well-to-wheel method, looking at the entire process from obtaining the raw material to the energy which gets our wheels rolling.
To create the greatest possible transparency we use CO2e instead of just CO2, which means we also take into account greenhouse gases that are much more damaging than CO2.